Every company benchmarks compensation in some form even if that form is a finance leader cross-referencing a handful of job postings before approving an offer. The question isn’t whether to benchmark. It’s whether the process is rigorous enough to produce decisions you can defend, fast enough to keep pace with a moving market, and structured enough to scale past the point where one person can hold it all in their head.
A compensation benchmarking tool is supposed to solve that problem. But “benchmarking tool” covers a wide range of products — from enterprise survey subscriptions to AI-powered market pricing engines — and the differences between them matter more than the category label suggests.
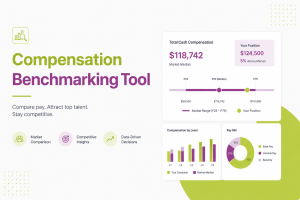
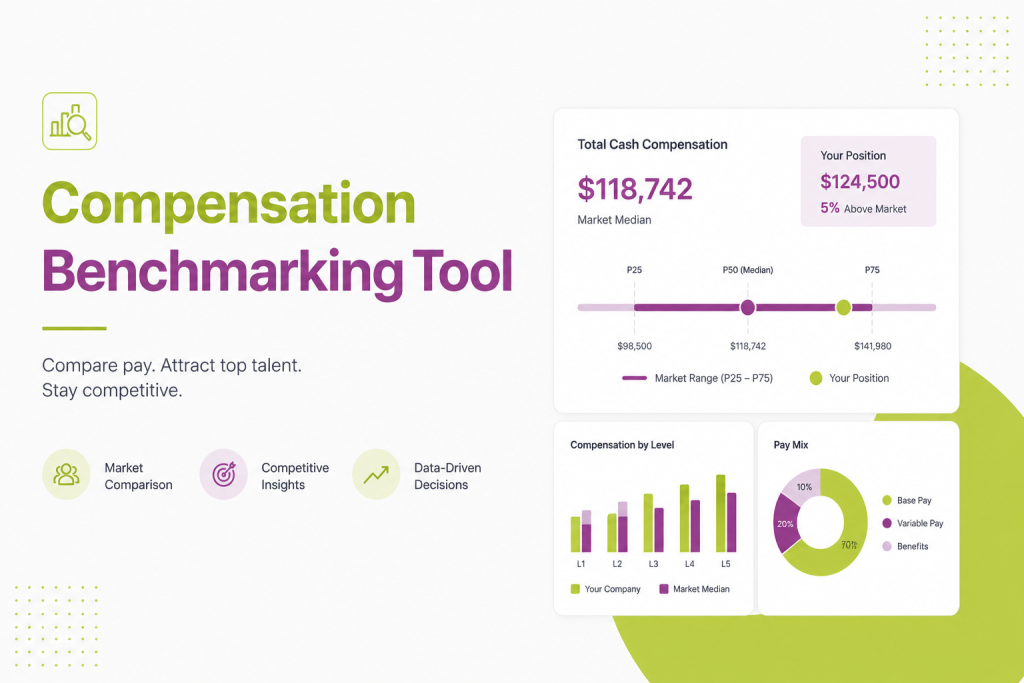
This guide walks through what a compensation benchmarking tool actually needs to do, the core capabilities worth evaluating, and the questions finance leaders should ask before committing budget to one.
- Benchmarking is only as good as its weakest link — usually job matching, data transparency, or whether the number ever turns into an actual decision.
- Job matching: Stello AI auto-generates salary ranges by level, department, and location — no manual taxonomy mapping required.
- Data transparency: A built-in Data Quality Score shows the company count, data points, and title-match precision behind every benchmark, so you know when to trust it.
- From data to action: Salary Band Comparison shows budget impact and anomalies; Employee Impact Insights and Internal Range Review show exactly who’s affected and what it costs before you commit.
- Beyond base pay: Compensation Planning connects benchmarking to equity and bonus strategy, not just salary.
- One platform, not a patchwork: Market Pricing sits alongside Budgets Modeling, Compensation Planning, and the Total Rewards Portal — plus Iconic, an AI agent that answers comp questions in seconds.
- Bottom line: Stello AI pairs transparent data with direct visibility into budget and employee impact — all in one workflow.
What a Compensation Benchmarking Tool Is Supposed to Solve
At its core, a compensation benchmarking tool answers one question: is this role, at this level, in this market, paid appropriately relative to what other companies are paying?
That sounds simple. In practice, answering it well requires solving several harder problems at once:
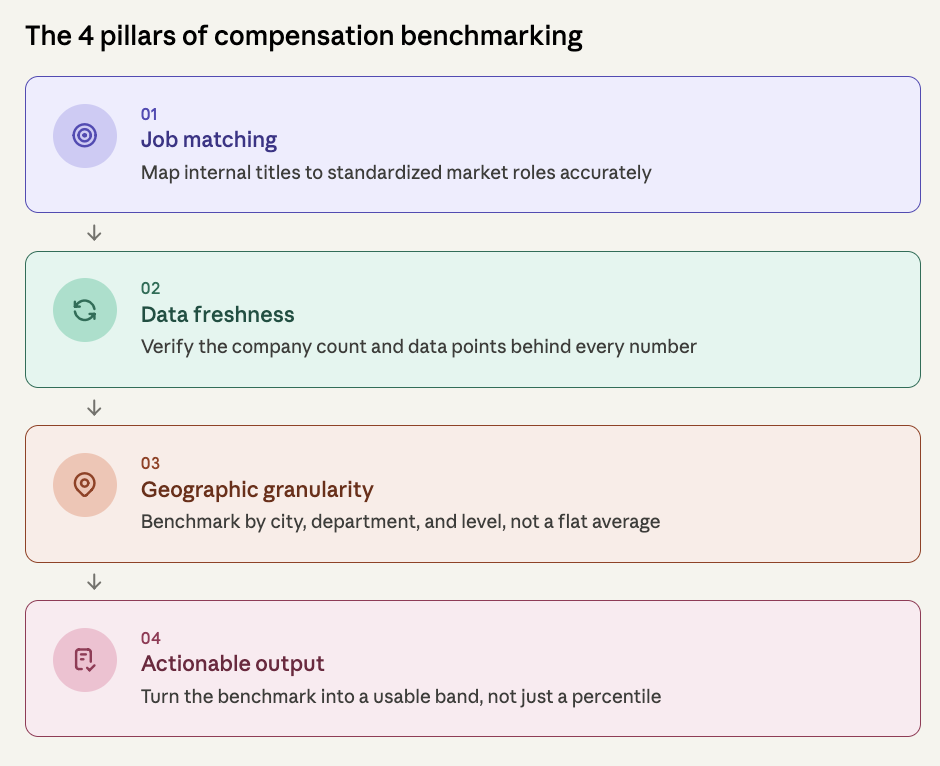
Job matching. Your internal job titles rarely map cleanly to standardized market roles. A “Senior Product Manager” at one company may have the scope of a Director elsewhere. Getting the match right is foundational — every benchmark downstream of a bad match is wrong by definition.
Data freshness. Compensation data has a shelf life. A benchmark built on data from eighteen months ago may already be stale in fast-moving markets, even if the underlying methodology was sound.
Geographic and market segmentation. Pay for the same role varies meaningfully by city, by industry, and by company stage. A tool that benchmarks against an undifferentiated national average is not precise enough to inform real offer decisions.
Percentile positioning. Knowing the market median isn’t enough. Finance teams need to decide where they want to sit relative to the market — and a useful tool should make that decision actionable, not just informational.
A compensation benchmarking tool that solves these four problems well gives finance and HR leaders something they can act on with confidence. One that solves them poorly produces numbers that look authoritative but don’t hold up under scrutiny.
Also read: AI Compensation Tools for Startups vs. Scale-ups: What You Actually Need
Core Capabilities to Evaluate
Job matching methodology
Ask any vendor directly: how does the tool match our internal roles to market benchmarks? Some platforms rely on a fixed taxonomy that you map your roles into manually — workable, but labor-intensive and prone to drift as your organization changes. Others use AI models trained on large volumes of job description data to automate the matching, flagging low-confidence matches for human review rather than guessing silently.
The second approach scales significantly better, particularly for organizations with non-standard roles or rapidly evolving job architecture. But automated matching is only as good as the confidence threshold the vendor uses — ask what percentage of matches typically require manual review, and what happens when a match is wrong.
Data sourcing and update frequency
Where does the underlying compensation data come from, and how often is it refreshed? Traditional survey-based tools pull from annual or semi-annual participant submissions — Radford, Mercer, and similar providers operate this way, and the data is generally high-quality but inherently lagged.
Newer platforms supplement or replace survey data with continuously updated sources: job postings, aggregated offer data, and in some cases anonymized data contributed by other users of the platform. Continuous data sourcing produces fresher benchmarks, but the trade-off is usually sample size and consistency — newer data sources may have less coverage for niche or senior roles than an established survey panel.
Neither approach is universally superior. The right choice depends on how fast your market moves and how much you’re willing to trade data depth for freshness.
Geographic and segment granularity
Check whether the tool benchmarks at the level of granularity that matches your actual hiring footprint. If you hire across multiple metro areas, industries, or company-stage cohorts, the tool needs to segment data accordingly — not collapse everything into a single national figure.
This matters disproportionately for remote-first and globally distributed teams. A platform that only handles U.S. metro-level data will create real gaps if a meaningful share of your hiring is international.
Percentile and band-setting workflow
The output of a good benchmarking tool isn’t a percentile chart — it’s an actionable band. Evaluate how easily the platform lets you translate “we want to be at the 65th percentile for engineering” into an actual salary range your hiring managers can use, and how the system handles edge cases (a role with thin market data, a level that doesn’t map cleanly to a standard band).
Some platforms stop at presenting percentile data and leave band construction as a manual exercise. Others build the band recommendation directly into the workflow, accounting for your stated compensation philosophy and budget constraints. The latter saves meaningful time during compensation cycles.
Equity benchmarking depth
If your company grants equity, this is the capability most worth scrutinizing closely — and the one where benchmarking tools vary most widely. Some platforms benchmark equity the same way they benchmark cash: grant size as a percentage of salary, compared against market norms. This is useful as a directional check but doesn’t capture the real picture.
A more rigorous approach benchmarks total equity value — accounting for the company’s current valuation, the employee’s vesting schedule, and the value of any existing grants — rather than comparing raw grant sizes in isolation. Ask vendors directly whether their equity benchmarking accounts for valuation and vesting context, or whether it’s limited to grant-size comparisons. The difference materially affects how useful the output is for retention decisions.
Integration with existing systems
A benchmarking tool that requires manual data exports from your HRIS to function creates exactly the kind of reconciliation overhead that automation is supposed to eliminate. Check whether the platform integrates directly with your HRIS, ATS, and (if applicable) equity management or cap table system, so benchmarks are generated against your actual current workforce data rather than a periodically refreshed export.
Also read: AI-Powered Compensation Benchmarking: How It Works
Questions to Ask During Evaluation
Beyond the feature checklist, a handful of direct questions tend to surface the real differences between platforms:
“What’s your data refresh cycle, and what happens between refreshes?” Some platforms update data continuously; others update quarterly or annually but present the data as if it’s current. Understanding the actual cadence avoids a false sense of recency.
“How do you handle roles with thin market data?” Niche, senior, or newly created roles often have small sample sizes. Ask how the platform flags low-confidence benchmarks rather than presenting them with the same authority as well-sampled roles.
“Can we customize percentile targets by function or level?” Most companies don’t want to benchmark every role to the same percentile. Engineering might warrant a more aggressive market position than back-office functions. The tool should support that level of customization without requiring a separate model for each function.
“What does implementation actually involve?” Ask for a realistic timeline, not a marketing one. Job matching, data integration, and band-setting workflows all take real configuration time — a platform that claims same-day implementation for a complex organization is probably oversimplifying what “implementation” means.
“How is equity valued, specifically?” As above — this is worth a direct, specific answer, not a general assurance that “equity is supported.”
When a Simpler Tool Is the Right Choice
Not every company needs the most sophisticated benchmarking platform available. Early-stage companies with under 50 employees often get sufficient value from lighter-weight, on-demand benchmarking tools rather than a full enterprise platform — the operational overhead of a comprehensive system isn’t justified at that scale.
The crossover point — where a more sophisticated platform starts paying for itself — tends to arrive as headcount grows past 100–150 employees, hiring volume increases, and the cost of inconsistent or stale benchmarking starts showing up in lost offers and retention gaps. We’ve covered this transition in more detail in our guide on AI compensation tools for startups vs. scale-ups.
Why Stello AI Is the Best Tool for Compensation Benchmarking
Most benchmarking tools ask you to trust a number. Stello AI asks you to verify it — then acts on it. That distinction is the whole case.
The Data Quality Score means finance teams aren’t guessing at confidence levels; they can see exactly how many companies and data points sit behind a benchmark before they build a band on top of it. Employee Impact Insights and Internal Range Review close the gap that most tools leave open: the space between “here’s the market rate” and “here’s what changing our band actually costs us, and who it affects.” And because Market Pricing lives inside the same platform as Compensation Planning, AI Budgets Modeling, and the Total Rewards Portal, a benchmarking decision doesn’t get stranded in its own spreadsheet — it flows straight into the rest of the comp cycle.
For finance and HR teams who’ve outgrown ad hoc spot-checks but aren’t ready for a full enterprise survey subscription, that combination of transparency, actionability, and integration is hard to find anywhere else.
Book a demo today.
The Bottom Line
A compensation benchmarking tool is only as good as its weakest link — and that link is rarely the dashboard or the user interface. It’s usually job matching accuracy, data freshness, or how seriously the platform treats equity valuation. Finance leaders evaluating these tools should spend less time on demo polish and more time asking pointed questions about methodology.
The right tool turns benchmarking from a periodic, effortful exercise into a continuous input to compensation decisions. The wrong one produces numbers that look precise but don’t hold up when an offer gets challenged or a board asks how a band was set.