Spreadsheets are the default tool for equity management at most companies. They’re flexible, familiar, and free. For a 20-person startup with a simple cap table and a handful of grants, they work fine.
But somewhere between 50 and 150 employees, spreadsheets stop being a practical solution and start being a liability. The transition is gradual enough that most finance teams don’t notice it happening — until an error surfaces, an audit flags an inconsistency, or a key employee raises a discrepancy in their vesting schedule that takes three days to resolve.
This article quantifies what manual equity management actually costs — in time, accuracy, and strategic opportunity — so finance leaders can make an informed decision about when the math stops working in spreadsheets’ favor.
TL;DR
- Spreadsheets work at 20 people. By 50–150 employees, they stop being a practical solution and start being a liability — the transition is gradual enough that most finance teams don’t notice until something breaks.
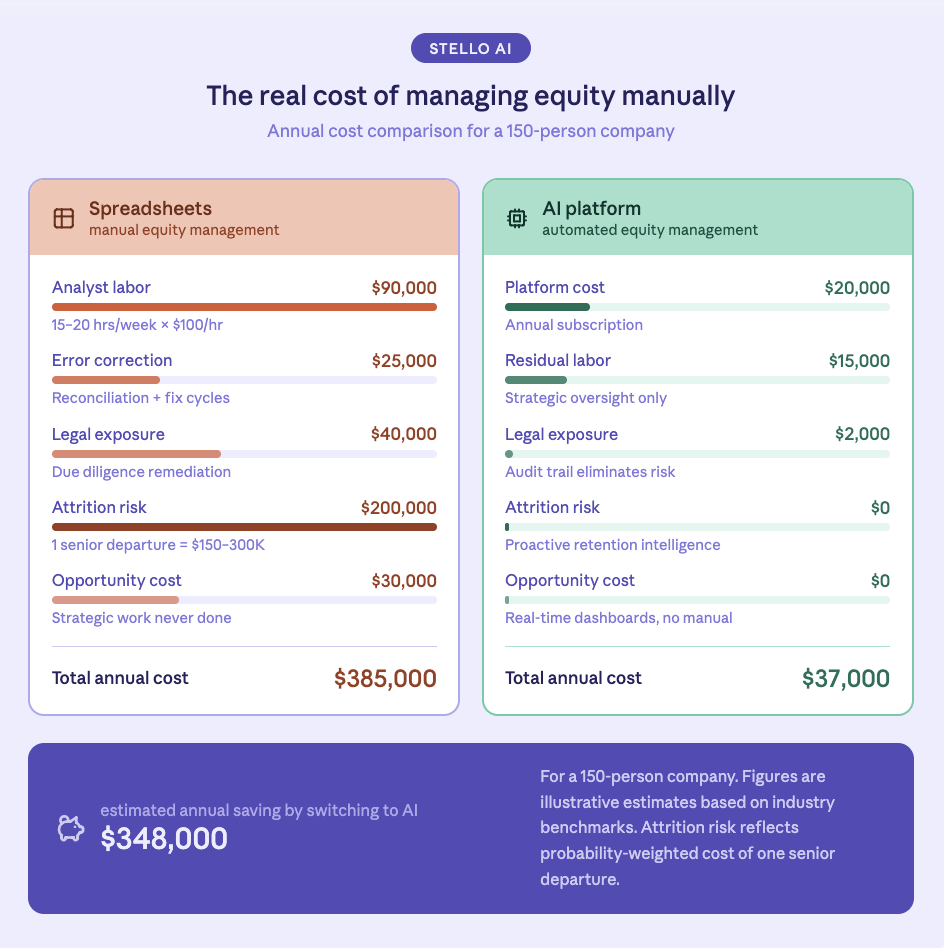
- The largest hidden cost is analyst labor: at 150 employees, manual equity management consumes 15–20 hours per week — $60,000–$120,000 per year in fully loaded analyst cost.
- Around 90% of large spreadsheets contain at least one material error. In equity management, where records are legally binding, that error rate is a financial and legal risk — not just an inconvenience.
- Spreadsheet-managed equity programs routinely surface discrepancies during due diligence, requiring weeks of legal remediation that can affect deal terms or delay closing.
- Equity errors erode employee trust — especially for employees who accepted below-market cash in exchange for equity. One preventable senior departure costs $150,000–$300,000 in recruiting and lost productivity.
- The crossover point — where platform cost is lower than the cost of manual management — happens at roughly 50–100 employees for most companies. Earlier than most finance teams expect.
- Process improvements to spreadsheets defer the problem. The right tooling solves it.
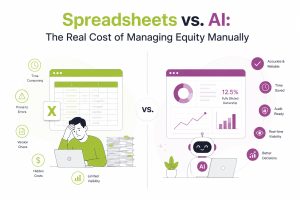
The Hidden Costs of Manual Equity Management
The direct cost of spreadsheet-based equity management is easy to underestimate because it doesn’t appear as a line item. It shows up in payroll hours, error correction cycles, delayed reporting, and the strategic work that never gets done because the operational work consumed the bandwidth.
1. Analyst Time: The Largest Hidden Cost
Managing equity in spreadsheets is labor-intensive in ways that compound with headcount. Every new hire requires a manual entry. Every grant requires a vesting schedule to be built and maintained. Every refresh cycle requires the spreadsheet to be updated across multiple tabs. Every employee departure triggers a calculation of unvested shares, post-termination exercise windows, and cap table adjustments.
At 50 employees, a reasonably organized finance or HR team can manage this in a few hours a week. At 150 employees with multiple grant types, overlapping vesting schedules, and a BoxCar-style refresh program running in parallel, the same tasks consume significantly more — often 15 to 20 hours per week across the team.
At a fully loaded cost of $80–$120 per hour for a mid-level finance analyst, that’s $60,000–$120,000 per year in labor allocated to tasks that could be automated. That figure doesn’t include the time spent by HR, legal, or executives who get pulled into equity questions that a self-serve system would resolve instantly.
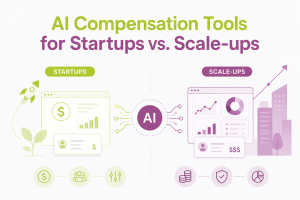
Also read: AI Compensation Tools for Startups vs. Scale-ups: What You Actually Need
2. Error Rate: The Cost That’s Hardest to See
Spreadsheets are error-prone by design. A mistyped date, a broken formula, a tab that didn’t update when the master changed — these are not edge cases. They are the normal operating condition of any spreadsheet that multiple people touch over time.
In equity management, errors carry consequences that extend well beyond a corrected cell. A vesting date entered incorrectly means an employee may be told they have shares that haven’t vested — or that they don’t have shares that have. A grant amount that doesn’t match the board approval creates a discrepancy that surfaces during due diligence and requires legal remediation. A refresh grant issued at the wrong size due to a formula error creates an obligation the company didn’t intend to make.
Research on spreadsheet error rates consistently finds that roughly 90% of spreadsheets containing more than a few hundred rows have at least one material error. For equity management — where the spreadsheet is the source of truth for legally binding grant records — that error rate is not a quality concern. It is a legal and financial risk.
3. Audit and Due Diligence Exposure
The moment a company begins preparing for a fundraise, an acquisition, or an IPO, the state of its equity records becomes a due diligence item. Investors and acquirers want clean, auditable grant records — board approvals matched to grant agreements, vesting schedules verified against cap table entries, employee records reconciled against payroll.
When equity has been managed in spreadsheets, the due diligence process routinely surfaces discrepancies. Reconciling those discrepancies takes time — typically weeks — and carries legal cost. In acquisition scenarios, material discrepancies in equity records can affect deal terms or delay closing.
The cost of cleaning up a spreadsheet-managed equity program before a transaction is consistently higher than the cost of running a proper equity management system from the start. Finance teams that have been through this process rarely go back to spreadsheets afterward.
4. Employee Trust and Retention Impact
Equity errors don’t stay internal. When an employee receives a vesting statement that doesn’t match their grant agreement, or when HR can’t answer a question about someone’s upcoming cliff date, the operational failure becomes a trust failure.
For employees who accepted below-market cash compensation in exchange for equity — which describes most employees at growth-stage companies — equity is not a benefit. It is a significant portion of their expected compensation. Errors, delays, or ambiguity in equity records signal organizational dysfunction and erode the retention value of the equity program itself.
The retention cost of a single senior employee departure — recruiting fees, onboarding time, and lost productivity — ranges from $150,000 to $300,000 at the director and above level. If spreadsheet-driven equity management contributes to even one departure per year that could have been avoided with better tooling, the cost of that failure exceeds the annual cost of most equity management platforms.
5. Strategic Opportunity Cost
This is the cost that finance leaders feel most acutely but quantify least often. When the equity management process is manual, the finance team’s bandwidth for strategic work shrinks accordingly.
Board reporting on equity expense requires a manual reconciliation before it can be prepared. Modeling the impact of a new refresh policy requires building the model from scratch. Answering “which employees are approaching their vesting cliff?” requires a query that takes an afternoon rather than a dashboard that updates in real time.
These aren’t trivial tasks. They’re the inputs to compensation strategy, retention planning, and board presentations. When they’re slow and effortful, they happen less often — and the quality of the decisions that depend on them suffers.
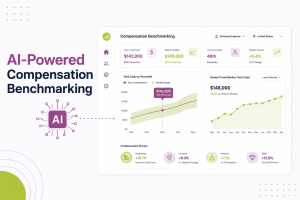
Also read: AI-Powered Compensation Benchmarking: How It Works
When Does the Math Stop Working?
The crossover point — where the cost of manual equity management exceeds the cost of a purpose-built platform — happens earlier than most finance teams expect.
A mid-market equity management platform typically costs $10,000–$30,000 per year depending on headcount and feature set. Against the labor cost, error exposure, and strategic opportunity cost outlined above, that investment pays back at roughly 50–100 employees for most companies.
Below that threshold, spreadsheets are a reasonable interim solution provided the team is disciplined about documentation and version control. Above it, the math favors automation — not because spreadsheets can’t technically handle the volume, but because the human cost of making them work correctly at scale exceeds the cost of the alternative.
What to Look for When Evaluating a Platform
For finance leaders who have reached the crossover point, the evaluation criteria should include:
Audit trail. Every grant action — issuance, modification, cancellation — should be logged with a timestamp and user attribution. This is the foundation of due diligence readiness.
Board approval workflow. Grant records should be linked to board approvals, with documentation stored in the system rather than in a separate folder that may or may not be current.
Vesting accuracy. The platform should handle all standard vesting structures — cliff, monthly, quarterly, performance-based — and flag exceptions automatically rather than relying on manual review.
Employee self-serve. Employees should be able to view their own grant records, vesting schedules, and upcoming milestones without routing requests through HR or Finance.
Scenario modeling. Finance teams should be able to model the budget and dilution impact of new grants, refresh programs, and headcount changes without exporting data to a separate spreadsheet.
The Bottom Line
Spreadsheets are not a compensation strategy. They are a tool that works at small scale and creates compounding risk as organizations grow. The cost of that risk — in analyst hours, error exposure, due diligence complexity, employee trust, and strategic bandwidth — is real and quantifiable.
The question is not whether to move away from spreadsheets. It is when. For most companies, the answer is earlier than they think.
1. At what company size should we stop managing equity in spreadsheets?
The crossover point is typically 50–100 employees. Below that, spreadsheets are manageable with discipline. Above it, the labor cost, error exposure, and audit risk consistently exceed the cost of a purpose-built platform.
2. How common are errors in spreadsheet-managed equity programs?
Very common. Research consistently finds that around 90% of large spreadsheets contain at least one material error. In equity management, where records are legally binding, that error rate is a financial and legal risk — not just an operational inconvenience.
3. Does spreadsheet-based equity management create problems during fundraising?
Almost always. Due diligence routinely surfaces discrepancies in spreadsheet-managed cap tables — mismatched grant records, missing board approvals, vesting errors. Cleaning these up costs weeks of time and legal fees, and in acquisition scenarios can affect deal terms.
4. What’s the actual annual cost of managing equity manually?
At 150+ employees, manual equity management typically consumes 15–20 hours per week across finance and HR. At a fully loaded analyst cost of $80–$120 per hour, that’s $60,000–$120,000 per year in labor alone — before factoring in error correction and strategic opportunity cost.
5. Can’t we just improve our spreadsheet process instead of switching platforms?
You can add controls, version tracking, and review cycles — and those help. But they don’t eliminate the core problem: spreadsheets require human effort to stay accurate, and that effort scales with headcount. A platform automates accuracy at any headcount. Process improvements defer the problem; tooling solves it.