Ask a room full of HR professionals what compensation benchmarking means, and most will say something like “comparing our salaries to the market.” That is technically correct, but it is like saying cooking is “putting heat on food.” The definition is accurate. The understanding is incomplete. And the gap between a surface-level understanding of compensation benchmarking and a practical one is exactly where companies make expensive mistakes.
Some companies benchmark once a year, update their salary ranges, and assume they are competitive for the next twelve months. Others benchmark constantly but against the wrong data, using surveys that do not represent their talent market or matching jobs based on titles instead of actual responsibilities. A few companies skip formal benchmarking entirely and set pay based on what it takes to close the next offer, creating internal equity problems that compound with every hire.
This guide covers what compensation benchmarking actually is, the methods companies use to do it, common mistakes that undermine accuracy, and real examples of how different organizations approach the process.
TL;DR
- → Compensation benchmarking is the systematic process of comparing your company’s pay against external market data to ensure competitiveness, equity, and strategic alignment.
- → The three primary methods are published survey data (rigorous but lagging), real-time platforms (fresh but sometimes limited in coverage), and custom peer group analysis (precise but small sample sizes).
- → Core metrics include compa-ratio, percentile targeting, range spread, and range penetration — these turn raw data into actionable pay decisions.
- → Common mistakes include matching jobs by title instead of role content, relying on a single data source, ignoring geographic differences, and benchmarking base salary only.
- → Modern compensation platforms like Stello AI streamline benchmarking with AI-powered job matching, real-time data integration, budget modeling, and full total compensation visibility.
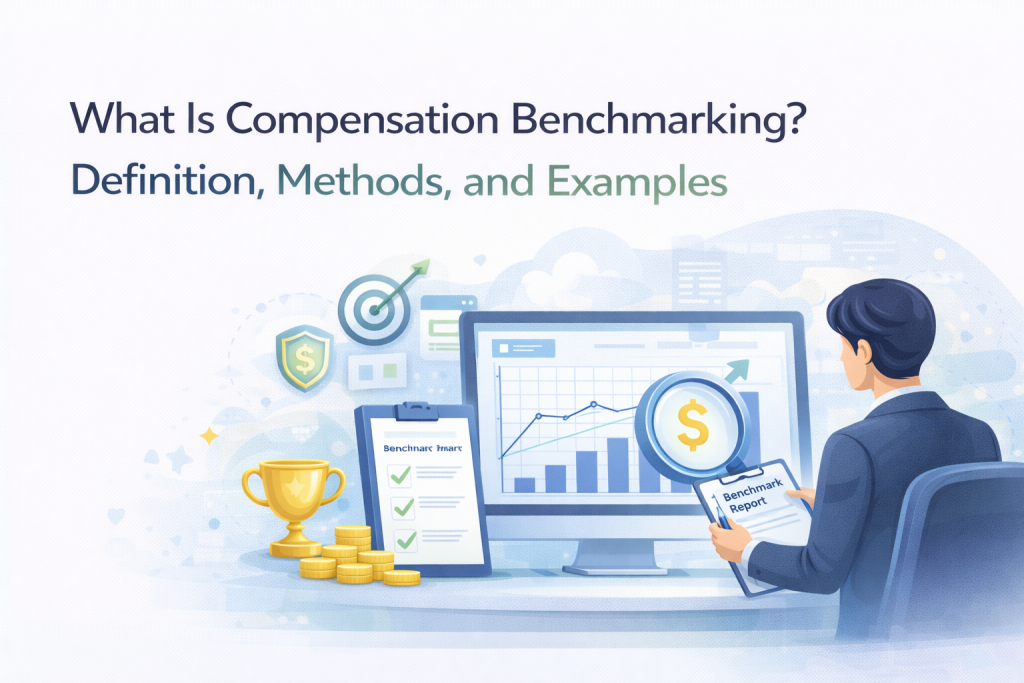
What Is Compensation Benchmarking?
Compensation benchmarking is the systematic process of comparing an organization’s pay practices against external market data to determine whether its compensation is competitive, equitable, and aligned with its talent strategy.
That definition has three parts that matter. First, it is systematic. Effective compensation benchmarking follows a repeatable methodology rather than ad hoc comparisons. Second, it uses external market data, not just internal budget targets or executive intuition. Third, the purpose is not just to know where you stand but to make informed decisions about where you should be.
In practical terms, compensation benchmarking answers a set of critical questions. Are we paying enough to attract the talent we need? Are we paying too much for roles where the supply of candidates exceeds demand? Are there roles where our pay has drifted significantly away from the market? Where should we invest our compensation budget to have the greatest impact on retention and performance?
The output of compensation benchmarking is typically a set of salary ranges, often expressed as a minimum, midpoint, and maximum for each role and level. These ranges become the foundation for every pay decision the company makes, from new hire offers to annual merit increases to promotion adjustments.
The Three Primary Methods of Compensation Benchmarking
Not every company approaches compensation benchmarking the same way. The method you use depends on your size, industry, budget, and how much precision you need.
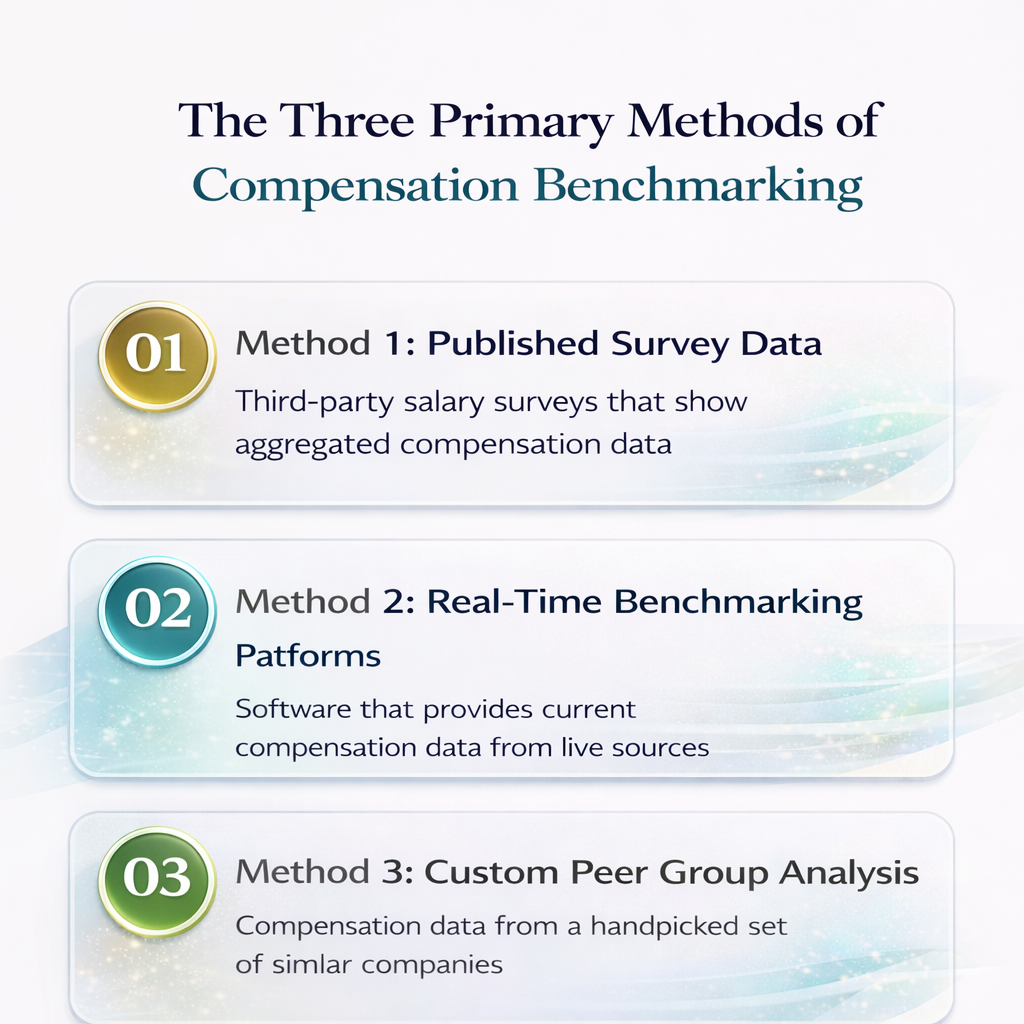
Method 1: Published Survey Data
This is the most common and widely accepted approach to compensation benchmarking. Companies participate in or purchase compensation surveys from providers like Radford (Aon), Mercer, Willis Towers Watson (WTW), and Salary.com. These surveys collect detailed pay data from hundreds or thousands of participating organizations and publish aggregated results by job function, level, industry, geography, and company size.
The advantage of published surveys is methodological rigor. The data is collected under confidentiality agreements, validated for accuracy, and presented at percentiles so companies can compare against the 25th, 50th, 75th, or 90th percentile, depending on their compensation philosophy.
The disadvantage is that survey data ages quickly. Most surveys reflect data that is six to twelve months old at the time of publication. In fast-moving talent markets, particularly for technology and specialized roles, this lag can be significant. Companies that use survey data without applying aging factors to project current market rates are making decisions based on where the market was, not where it is.
Example: A 2,000-person financial services company participates in WTW and Mercer surveys annually. They use WTW as their primary source for corporate functions and Mercer for technology roles where WTW coverage is thinner. They apply a 3.5 percent aging factor to all survey data to project forward to their cycle date. The blended, aged data sets their salary range midpoints, which they review against internal compa-ratios before the annual merit cycle.
Method 2: Real-Time Benchmarking Platforms
A newer approach to compensation benchmarking uses platforms that aggregate pay data in real time from companies that connect their HRIS systems. Instead of an annual survey, the data updates continuously as companies change salaries, make new hires, and adjust compensation. Platforms like Pave, Ravio, and others have built proprietary datasets using this approach.
The advantage is freshness. You are comparing against what companies are paying right now, not what they reported six months ago. The data also tends to be more granular because it comes from actual payroll records rather than survey submissions that may be approximated.
The disadvantage is coverage. Real-time platforms typically have stronger data for technology companies and specific geographies. A manufacturing company in the Midwest or a healthcare system in the Southeast may not find sufficient matches in a platform that skews heavily toward Bay Area tech startups. The data can also be less rigorous in its methodology compared to established survey providers that have decades of experience controlling for variables.
Example: A 400-person tech company uses Pave as its primary benchmarking source because Pave’s dataset skews heavily toward tech and covers the US market well. They supplement with Radford data for engineering leadership roles where Pave’s sample size is smaller. They refresh benchmarks quarterly using Pave’s real-time data feed rather than waiting for annual survey publications.
Method 3: Custom Peer Group Analysis
Some organizations build custom compensation benchmarking by directly comparing pay against a defined peer group. This is most common among public companies that disclose executive compensation in proxy statements, but it can be applied more broadly using survey cuts or platform data filtered to a specific set of competitors.
The advantage is precision. Instead of benchmarking against thousands of companies across an industry, you benchmark against the fifteen or twenty companies that you actually compete with for talent. This is particularly useful when your talent competitors are not the same as your business competitors. A mid-size fintech company might compete for engineering talent against Google and Stripe, not against other mid-size fintechs.
The disadvantage is the sample size. A peer group of fifteen companies may not provide statistically reliable data at granular job levels. One outlier can skew the results significantly. Custom peer group analysis works best as a supplement to broader compensation benchmarking data, not as a replacement.
Example: A publicly traded biotech company defines a peer group of twelve companies based on market cap, therapeutic area, and stage of pipeline. They use this peer group for executive benchmarking and supplement with Radford survey data for the broader employee population. The peer group is reviewed and updated annually by the compensation committee.
Key Metrics in Compensation Benchmarking
Compensation benchmarking produces data. Turning that data into decisions requires understanding a few core metrics.
Compa-ratio measures an employee’s pay relative to the midpoint of their salary range. A comp-ratio of 1.0 means the employee is paid exactly at the midpoint. A ratio of 0.85 means they are paid fifteen percent below it. Compa-ratios are the most widely used metric for assessing whether individuals and groups are paid competitively.
Percentile targeting defines where your company aims to position pay relative to the market. Targeting the 50th percentile means paying at the market median. Targeting the 60th or 75th percentile means deliberately paying above market, typically for critical roles or in tight talent markets. Your percentile target should flow directly from your compensation philosophy.
Range spread is the percentage difference between the minimum and maximum of a salary range. Typical range spreads are 40 to 60 percent for professional roles and wider for executive roles. The spread determines how much room exists for pay progression within a level before a promotion is required.
Range penetration shows where an employee’s pay falls within the full salary range from minimum to maximum. Unlike compa-ratio, which is anchored to the midpoint, range penetration shows the employee’s position relative to the full range, which is more useful for assessing career progression and pay equity.
Common Compensation Benchmarking Mistakes
Matching by title instead of content. A “Director of Operations” at a 200-person startup has a fundamentally different scope than one at a 10,000-person enterprise. Matching by title alone produces misleading benchmarks. Effective matching uses job descriptions, reporting relationships, budget responsibility, and scope.
Using unblended single sources. Every survey has coverage gaps and biases. Companies that rely on a single source get an incomplete and potentially skewed view of the market. Blending two or three sources with appropriate weighting produces more reliable benchmarks.
Ignoring geographic differentials. Remote work has complicated geographic compensation benchmarking, but location still matters. A software engineer in San Francisco and one in Raleigh operate in different labor markets with different cost structures. Companies that use a single national benchmark without geographic adjustments will overpay in some markets and underpay in others.
Benchmarking base salary only. Candidates and employees increasingly compare total compensation, including equity, bonuses, benefits, and other non-cash rewards. Compensation benchmarking that only covers base salary misses a significant portion of the competitive picture, especially in technology and executive roles where equity can represent 30 to 50 percent of total compensation.
How Compensation Planning Software Modernizes Benchmarking
The traditional compensation benchmarking process is manual, time-consuming, and done infrequently. Modern compensation planning software changes each of those constraints.
Stello AI’s approach starts with AI Market Pricing, which accelerates job matching and salary benchmarking by using AI to analyze role content rather than relying on title-to-title matching. What used to take weeks of manual analyst work happens in hours with human review at the validation stage.
The benchmarking data feeds directly into Stello’s compensation cycle management, so market positioning informs merit decisions in real time. Managers see compa-ratios and AI-powered salary increase recommendations based on merit matrix calculations alongside current benchmarking data. There is no gap between when benchmarks are set and when they are used.
Stello’s AI Budget Modeling lets HR and finance teams model the cost of bringing employees up to market targets across different scenarios while maintaining pay equity. When compensation benchmarking reveals that your engineering team is ten percent below the 50th percentile, you can immediately model what it costs to close that gap and compare it against alternative budget allocations.
The AI Compensation Agent answers benchmarking questions on demand. Instead of building custom reports, an HR business partner can ask how a specific team compares to the market and get the answer in seconds.
The platform manages the full compensation picture, including base salary, bonuses, and equity with support for RSUs, stock options, profit sharing, and complex vesting schedules. This enables total compensation benchmarking rather than base-only comparisons. Stello integrates with existing HRIS, performance management tools, equity platforms, benefits systems, and Excel files. And the Total Rewards Portal gives employees year-round access to personalized statements that show where their compensation stands relative to the full picture.
Making Compensation Benchmarking Work for Your Organization
Compensation benchmarking is not a one-time project. It is an ongoing discipline that determines whether your pay decisions are grounded in reality or based on outdated assumptions. The companies that benchmark well attract better talent, retain more of their top performers, maintain pay equity proactively, and spend their compensation budgets more efficiently.
Whether you are running compensation benchmarking for the first time or rebuilding a process that has drifted, the principles are the same: use multiple data sources, match on role content, not titles, apply aging factors to keep data current, benchmark total compensation rather than base alone, and invest in tools that make the process fast enough to do continuously rather than annually.
Frequently Asked Questions
What does benchmarking mean in compensation?
Compensation benchmarking is the systematic process of comparing your organization’s pay against external market data to determine whether compensation is competitive, equitable, and aligned with your talent strategy. The output is typically salary ranges expressed as minimum, midpoint, and maximum for each role and level.
How to do compensation benchmarking?
Start by defining your compensation philosophy and percentile target. Select data sources like Radford, Mercer, or real-time platforms like Pave. Match your internal roles to survey data based on job content, not titles. Apply aging factors to adjust for data lag. Blend multiple sources for reliability. Build salary ranges from the benchmarked midpoints. Then compare internal pay against the new ranges using compa-ratios to identify gaps and prioritize adjustments.
What is the first step in compensation benchmarking?
Defining your compensation philosophy. Before opening any survey data, decide where your company intends to position pay relative to the market — 50th percentile, 60th, 75th — and whether that target varies by role type, function, or geography. Every downstream benchmarking decision flows from this foundation.
What are the 4 steps of benchmarking?
Select your data sources and comparator market, match internal roles to survey data based on job content and responsibilities, analyze the data by applying aging factors and blending multiple sources into salary ranges, and take action by comparing internal pay against new ranges and adjusting where gaps exist. Some organizations add a fifth ongoing
What is a compa-ratio and why does it matter?
It measures an employee’s pay relative to their salary range midpoint. A compa-ratio of 1.0 means paid at midpoint. Below 1.0 means below market. It is the most widely used metric for assessing whether individuals and teams are paid competitively.
What are the most common compensation benchmarking mistakes?
Matching jobs by title instead of role content, relying on a single unblended data source, ignoring geographic pay differentials, and benchmarking base salary only when candidates compare total compensation, including equity, bonuses, and benefits.
How does Stello AI improve the benchmarking process?
AI Market Pricing matches jobs based on role content rather than titles, cutting weeks of manual work to hours. Benchmarking data feeds directly into merit recommendations and budget modeling. The AI Compensation Agent answers benchmarking questions on demand. And the platform supports total compensation benchmarking across base salary, bonuses, and equity in one system.
Ready to see how AI-powered compensation benchmarking can cut your process from weeks to hours?
Book a demo with Stello AI and experience benchmarking built for modern organizations.